In this lesson, we’ll show you how to set up a basic lab in the free version of Cisco Modeling Labs (CML) and explore the data encapsulation process we’ve covered in this section of the course. The lab requires some effort to get started, so it is best suited for students who are eager to dive in and spend some additional time truly understanding the topic.
What is Cisco Modeling Labs (CML)?
Cisco Modeling Labs (CML) is a software tool that lets you build real networks in a virtual environment using virtual devices. This makes it easier and cheaper to practice networking without needing physical equipment. CML is a must-have tool for students and network engineers who prepare for certifications like the CCNA and CCNP. There are a few alternative solutions that can also be used, such as EVE-NG, GNS3, and PNETlab. However, I find Cisco CML to be the best option, especially for entry-level students, since it is Cisco-made, offers a free version, and is under active development.
In this lab, we will take advantage of the latest CML version 2.9.x, which has two significant improvements: Docker Container Support and Git Integration.
- Now you can use containers instead of full virtual machines. CML 2.9 ships with several useful container nodes out of the box: Web Browsers (Chrome, Firefox), routing tools (FRR), services (DNSmasq, Nginx, TACACS+, RADIUS), monitoring tools (Net-tools, ThousandEyes agent), and more.
- Additionally, you can link CML directly to Git repositories (e.g., GitHub). CML will sync and show your lab files automatically under the Sample Labs menu. No more manual downloading. Cisco already preloads labs from its community repo.
If you are interested in how to set up your CML environment from scratch, you can check this lesson. Now, let's go back to the current lab.
Lab Topology
We are going to use a very simple topology that is shown in the diagram below.

We have a Docker container with a web browser (Chrome), which we will use to open web pages via HTTP. On the other side, we have an Nginx web server that hosts one elementary web page. In the middle, we have a router with two interfaces that simply connect the two containers together.
Lab Setup
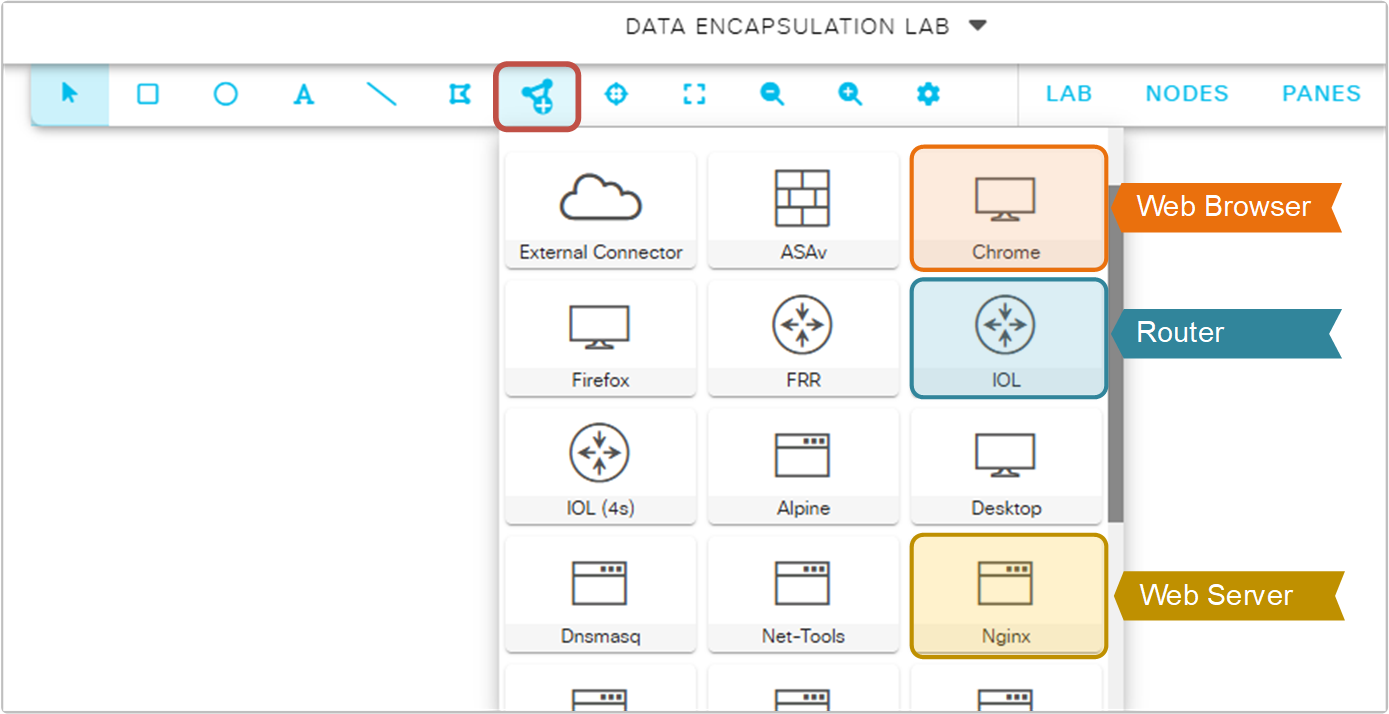
Let's quickly see how to set up the topology in your CML instance. First, you create a new lab named "Data Encapsulation Lab" via the ADD button on the CML's homepage. Then, via the Add Nodes button, you add a web browser, router, and web server, using the nodes shown in the screenshot below.
Connecting the nodes
Next, you must connect the nodes together as shown in the lab topology diagram. To do so, you right-click on each node and select the Add Link function. It is pretty easy and self-explanatory. In the end, you should have a topology as shown in the screenshot below.
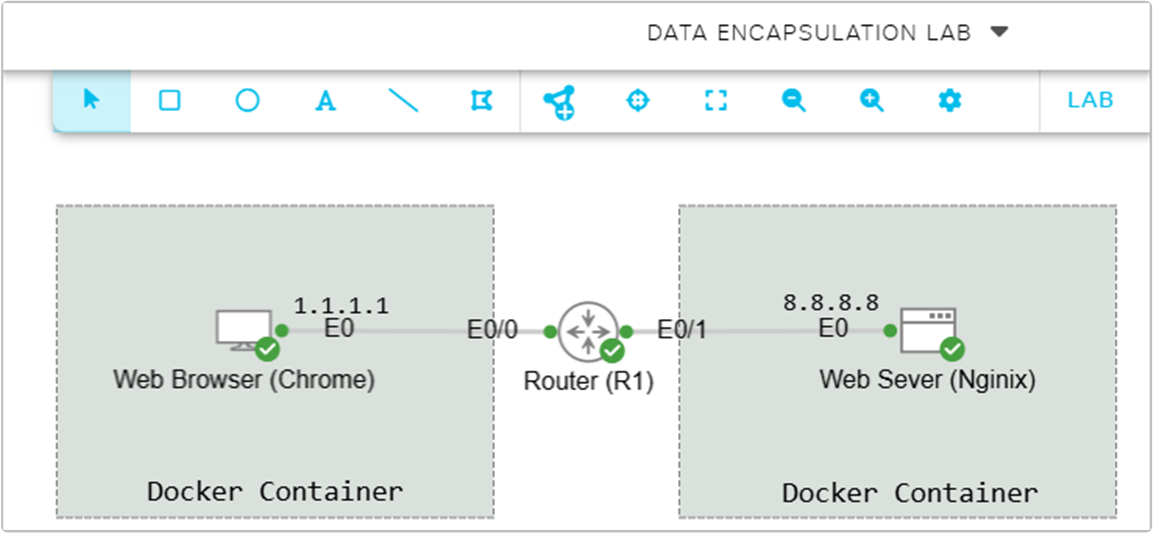
Pay attention to the interface numbers - the container nodes use e0, while the router uses e0/0 and e0/1. They are important when you configure IP addresses. Very often, students use the wrong interface number and struggle to make the lab work.
Nodes Configuration
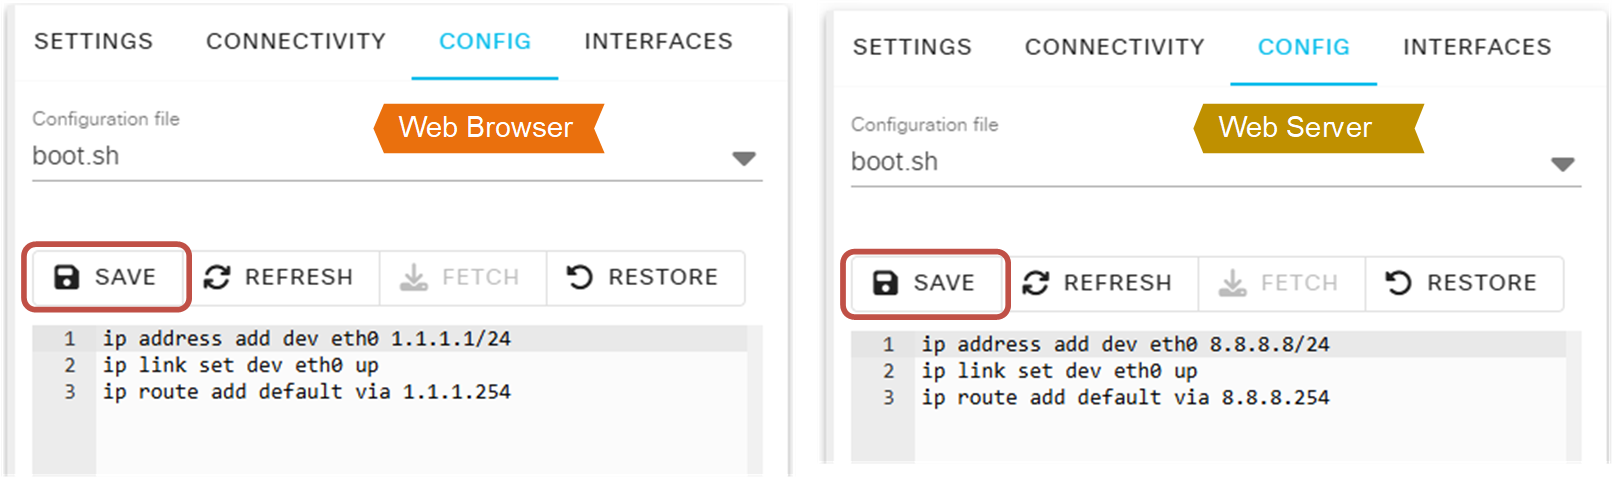
Next, we need to configure the nodes before powering them up. First, let's start with the container nodes - the web browser (Chrome) and the web server (Nginix). We go to the CONFIG tab and add the following configuration as shown in the screenshot below. Pay attention to the interface numbers - both nodes use eth0.
Next, we need to configure the router. We go to the router's Config tab and configure the two interfaces with IP addresses as shown in the screenshot below. Pay attention to the interface numbers.
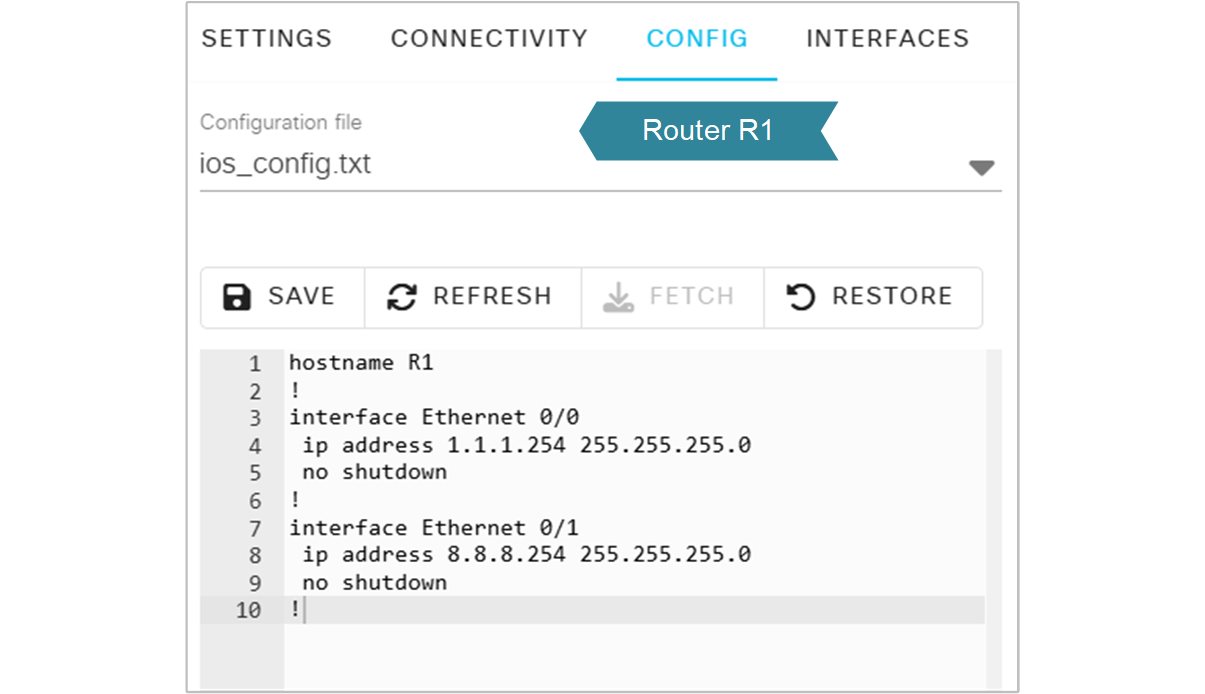
The following diagram summarizes the configuration of each node into one image, allowing you to identify which configuration is configured on which device easily.

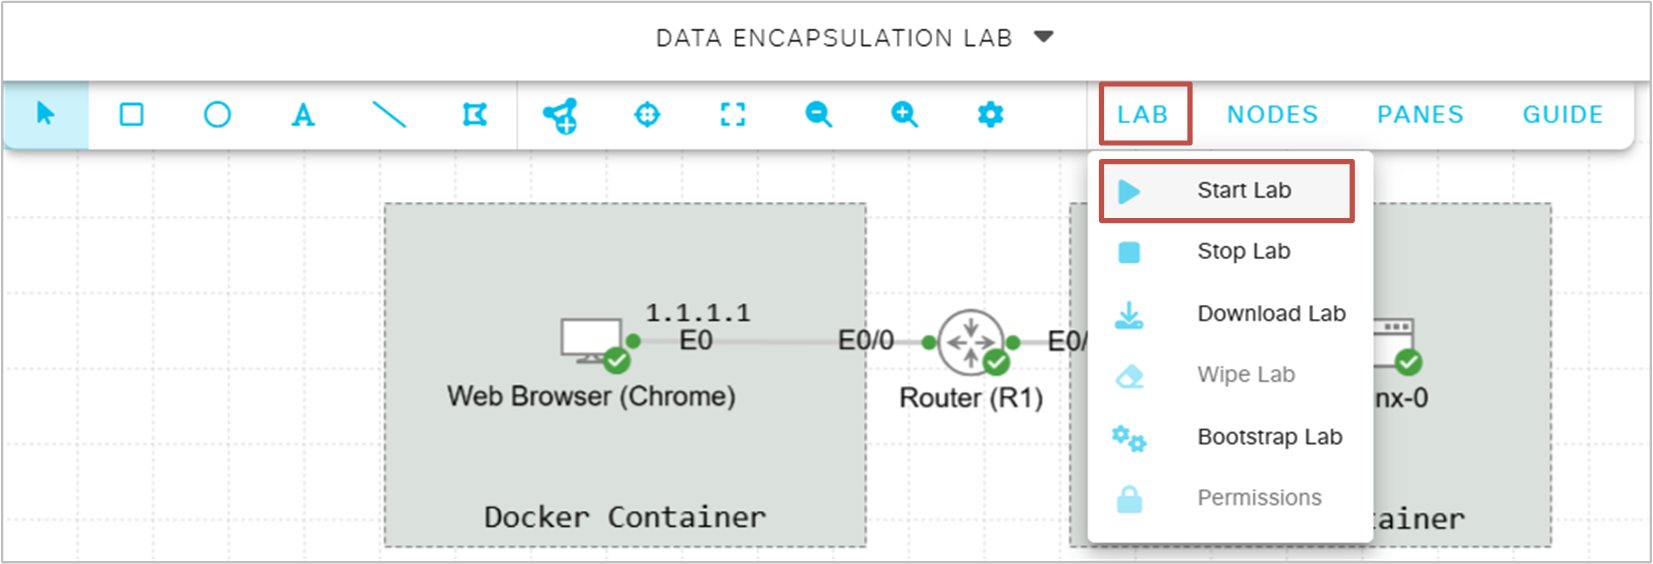
Now we can power up the lab by going to the LAB tab and then clicking the Stat Lab button, as shown in the screenshot below. The three nodes must have a green check icon that shows they are operational.
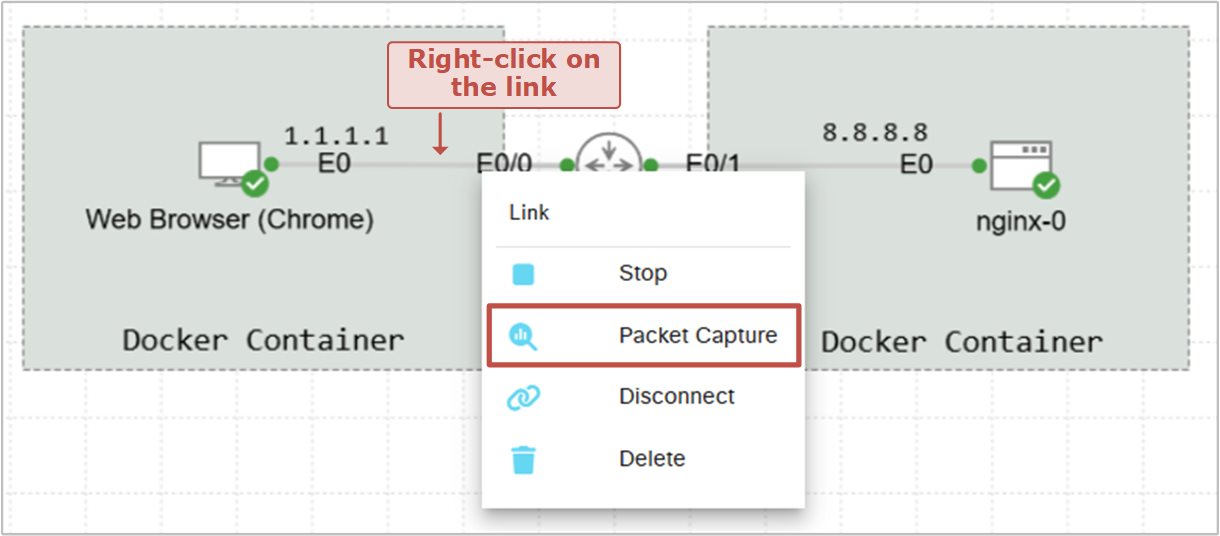
Once the nodes have started, you can start a packet capture on one of the links and observe the packets that traverse that link. The following screenshot shows how to do it. You right-click on the link you want and select "Packet Capture".
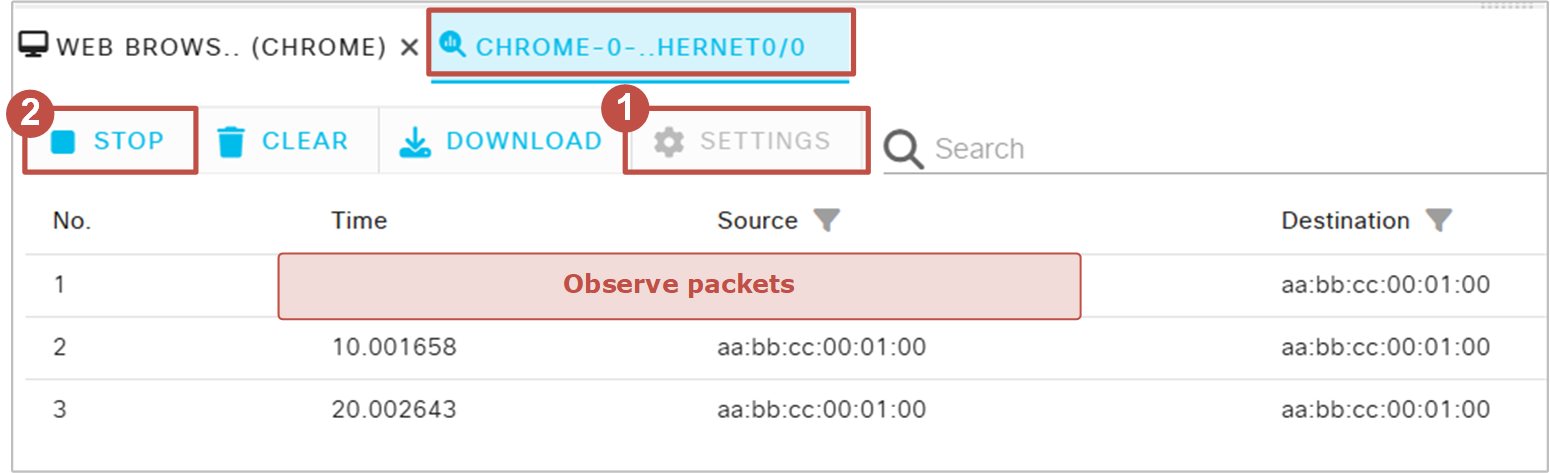
Once you start the packet capture, it will open in the bottom section of the browser, as shown in the screenshot below. Then you will see a few buttons as follows:
- Start/stop button used to turn on and off the capture.
- Clear button to clear the current set of captured packets.
- Download button to download the packet capture in pcap format and open it in another application such as Wireshark.
- Settings button to change the capture's parameters.
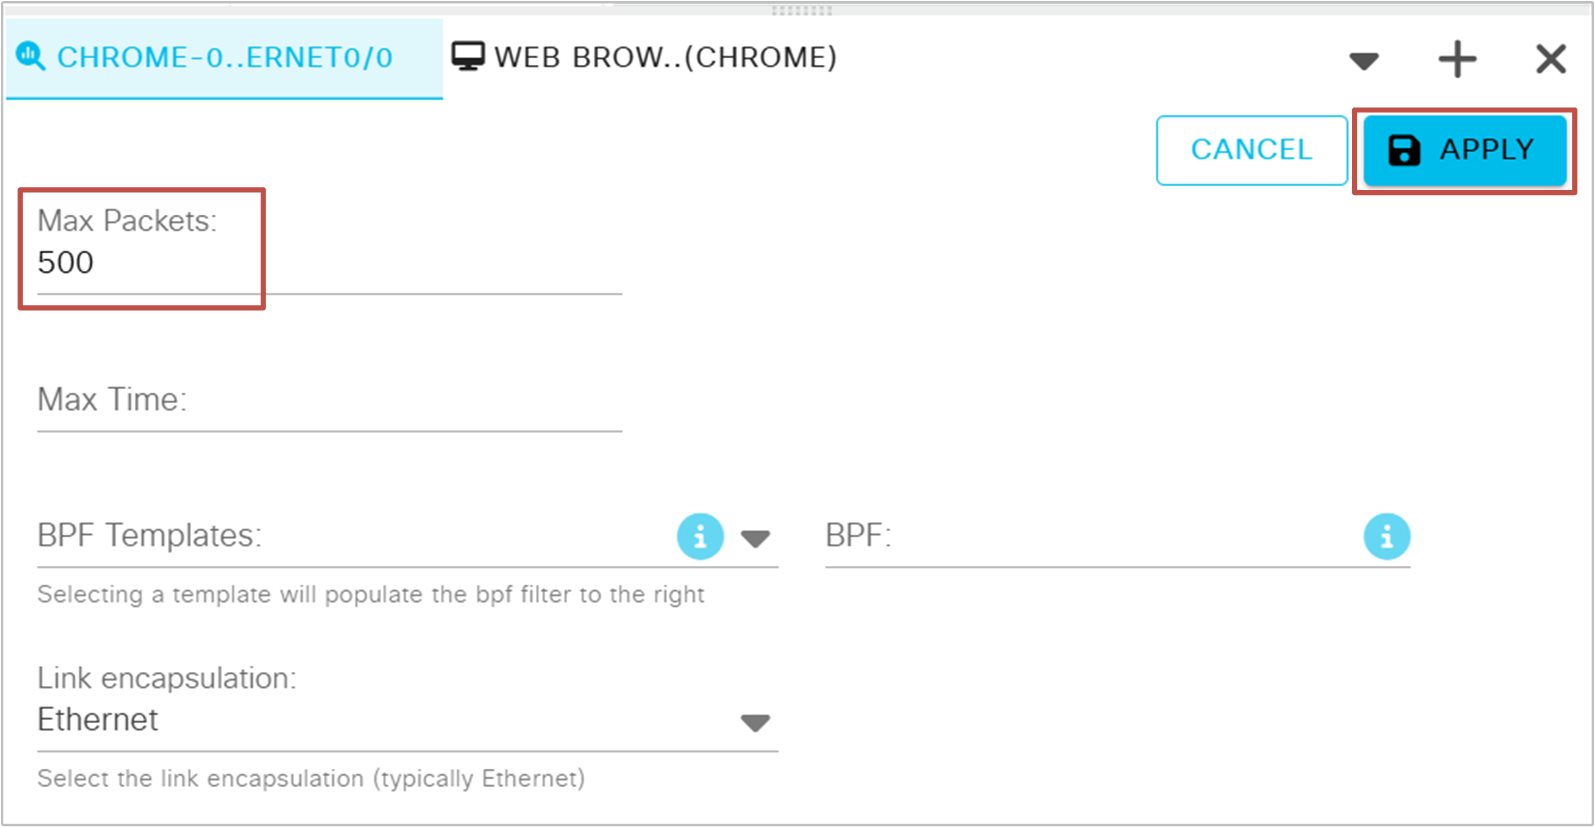
By default, the capture only captures 50 packets and then automatically stops. You would likely want to change that behaviour from the very beginning. Navigate to Settings > Max Packets and adjust the value to a higher number, such as 500 or more packets, and click Apply, as shown in the screenshot below.
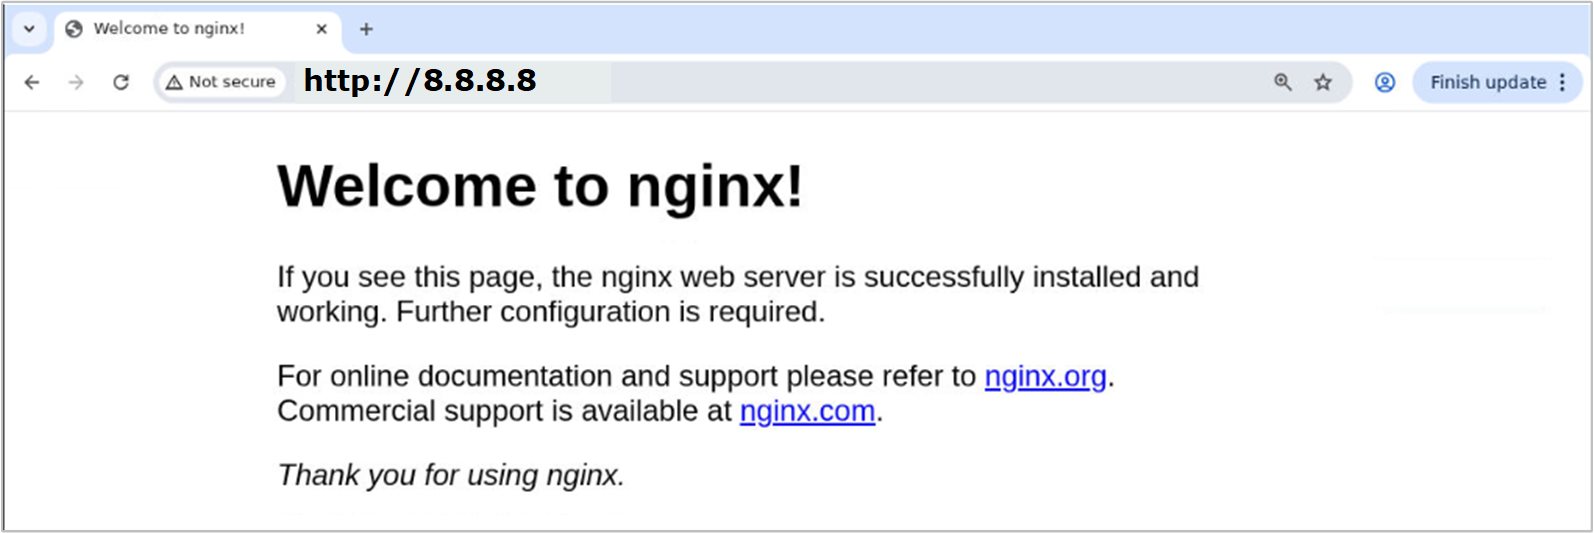
After setting up and starting the packet capture, open the Web Browser node (Chrome) by right-clicking on the icon and selecting VNC. It will open the Chrome browser at the bottom of the screen. From the browser, you request the root webpage from the Web Server (Nginx) as shown in the screenshot below.
This will make the web browser container first initiate a TCP three-way handshake with the web server (Nginx), as shown in the diagram below.

You can observe the actual network packets being exchanged between the web browser and the web server on the traffic capture tab, as shown in the screenshot below. Notice that you can filter by protocol type and other packet properties.
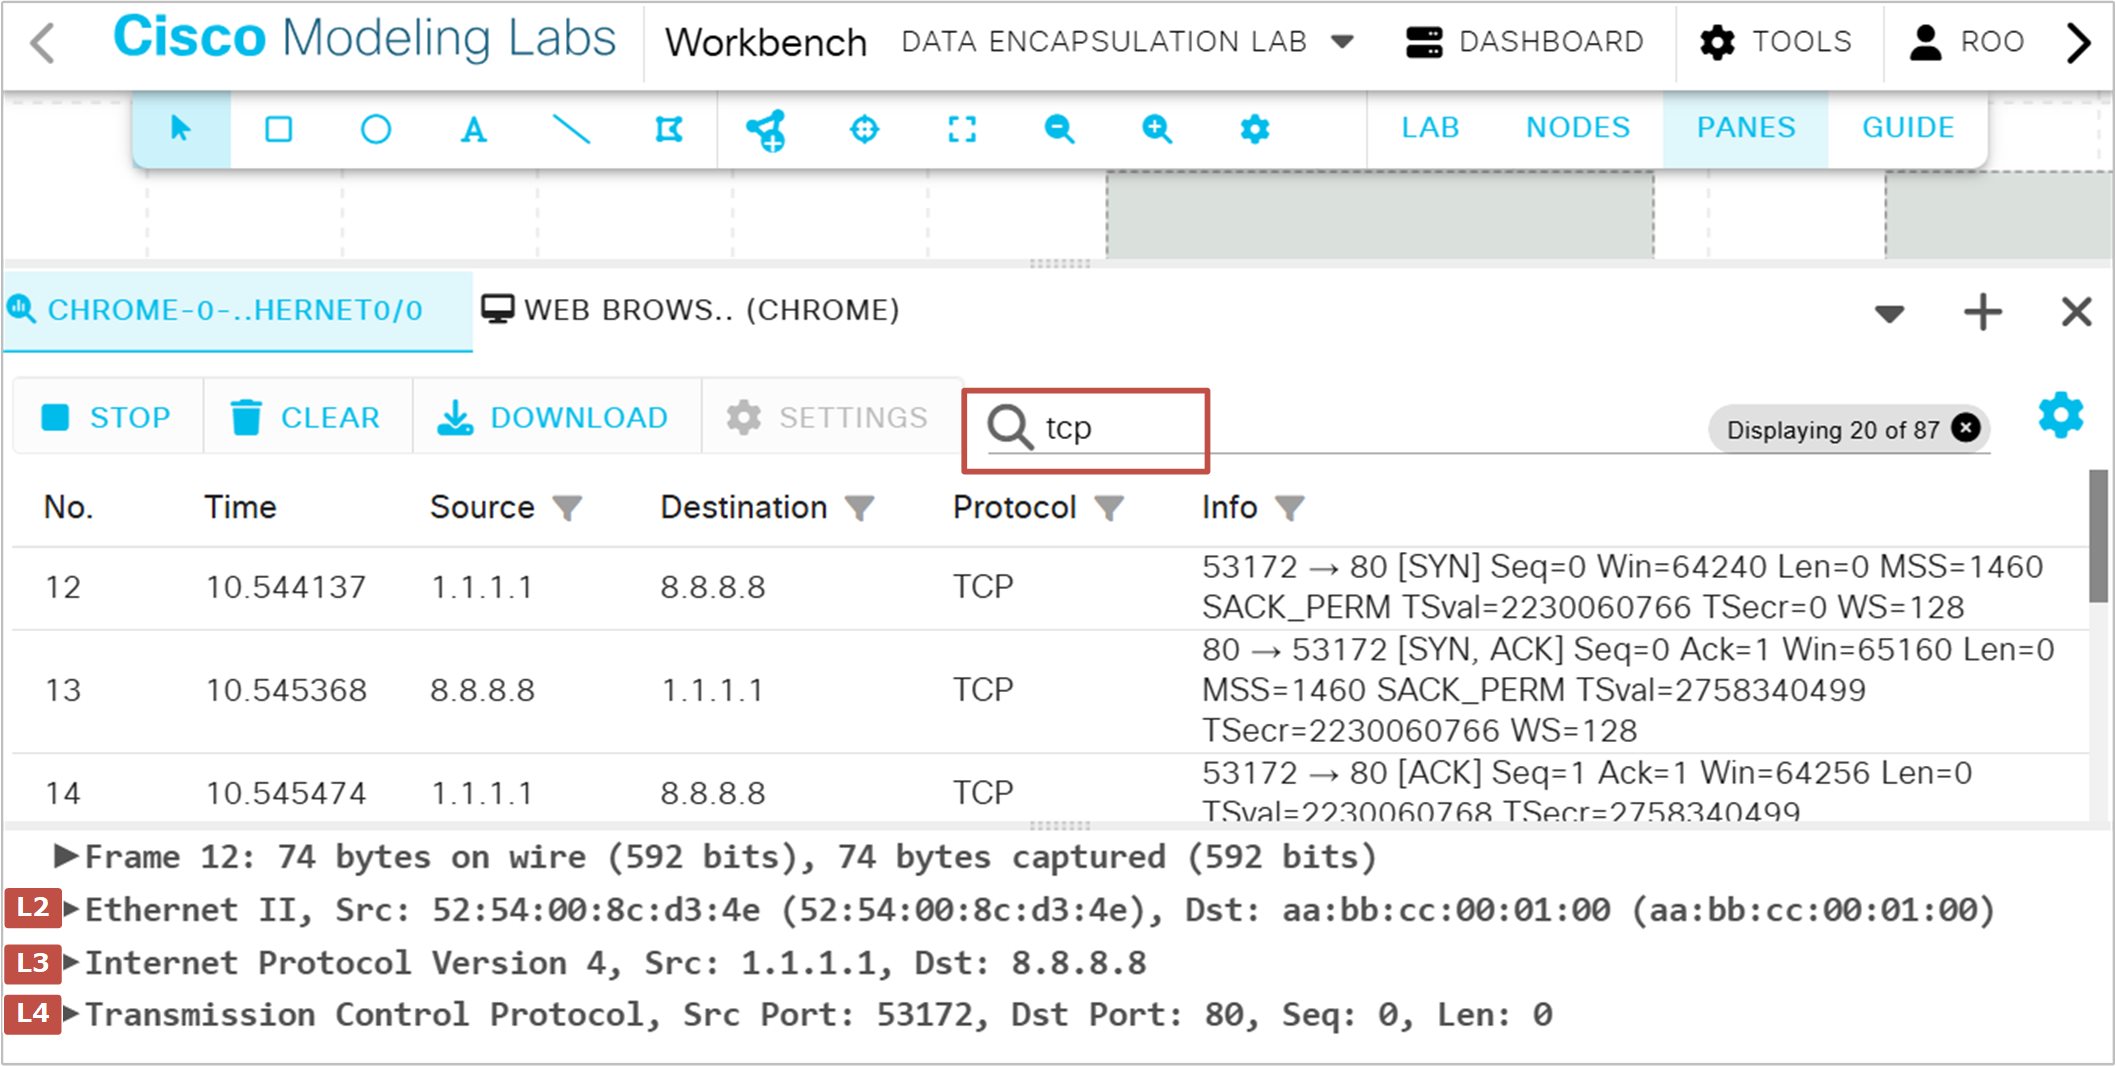
Pay attention to the TCP three-way handshake shown above. The first packet is the TCP SYN from the web browser to the web server. This packet initiates the TCP connection.
The server replies with TCP SYN-ACK, which means it accepts the connection.
Then the web browser replies with a TCP ACK, which establishes the connection in both directions.
At this point, the TCP connection is established. The web browser requests the root web page from the server via HTTP GET. The web server replies with HTTP 200 OK and sends back the web page.
Next Steps in CML to deepen understanding
If you successfully ran the lab as shown in the lesson, you can now explore the different headers of each packet. Pay special attention to source and destination IP addresses in the Layer 3 header, source and destination ports in the Layer 4 header, and the TCP flags used to establish and maintain the TCP connection. Try the following additional steps:
- Capture traffic on different links (browser–router, router–server) and compare headers. Note that the layer 2 header changes at every hop, while the layer 3 and layer 4 headers remain the same throughout the entire traffic path.
- Save the packet capture as a .pcap and analyze it in Wireshark for more detailed views.